

As an example, we would like to provide you a couple of detached houses, townhouses, apartments/condos sold in May 2019. Please compare the initial price and sold price with how many days on market, to understand the market trends.

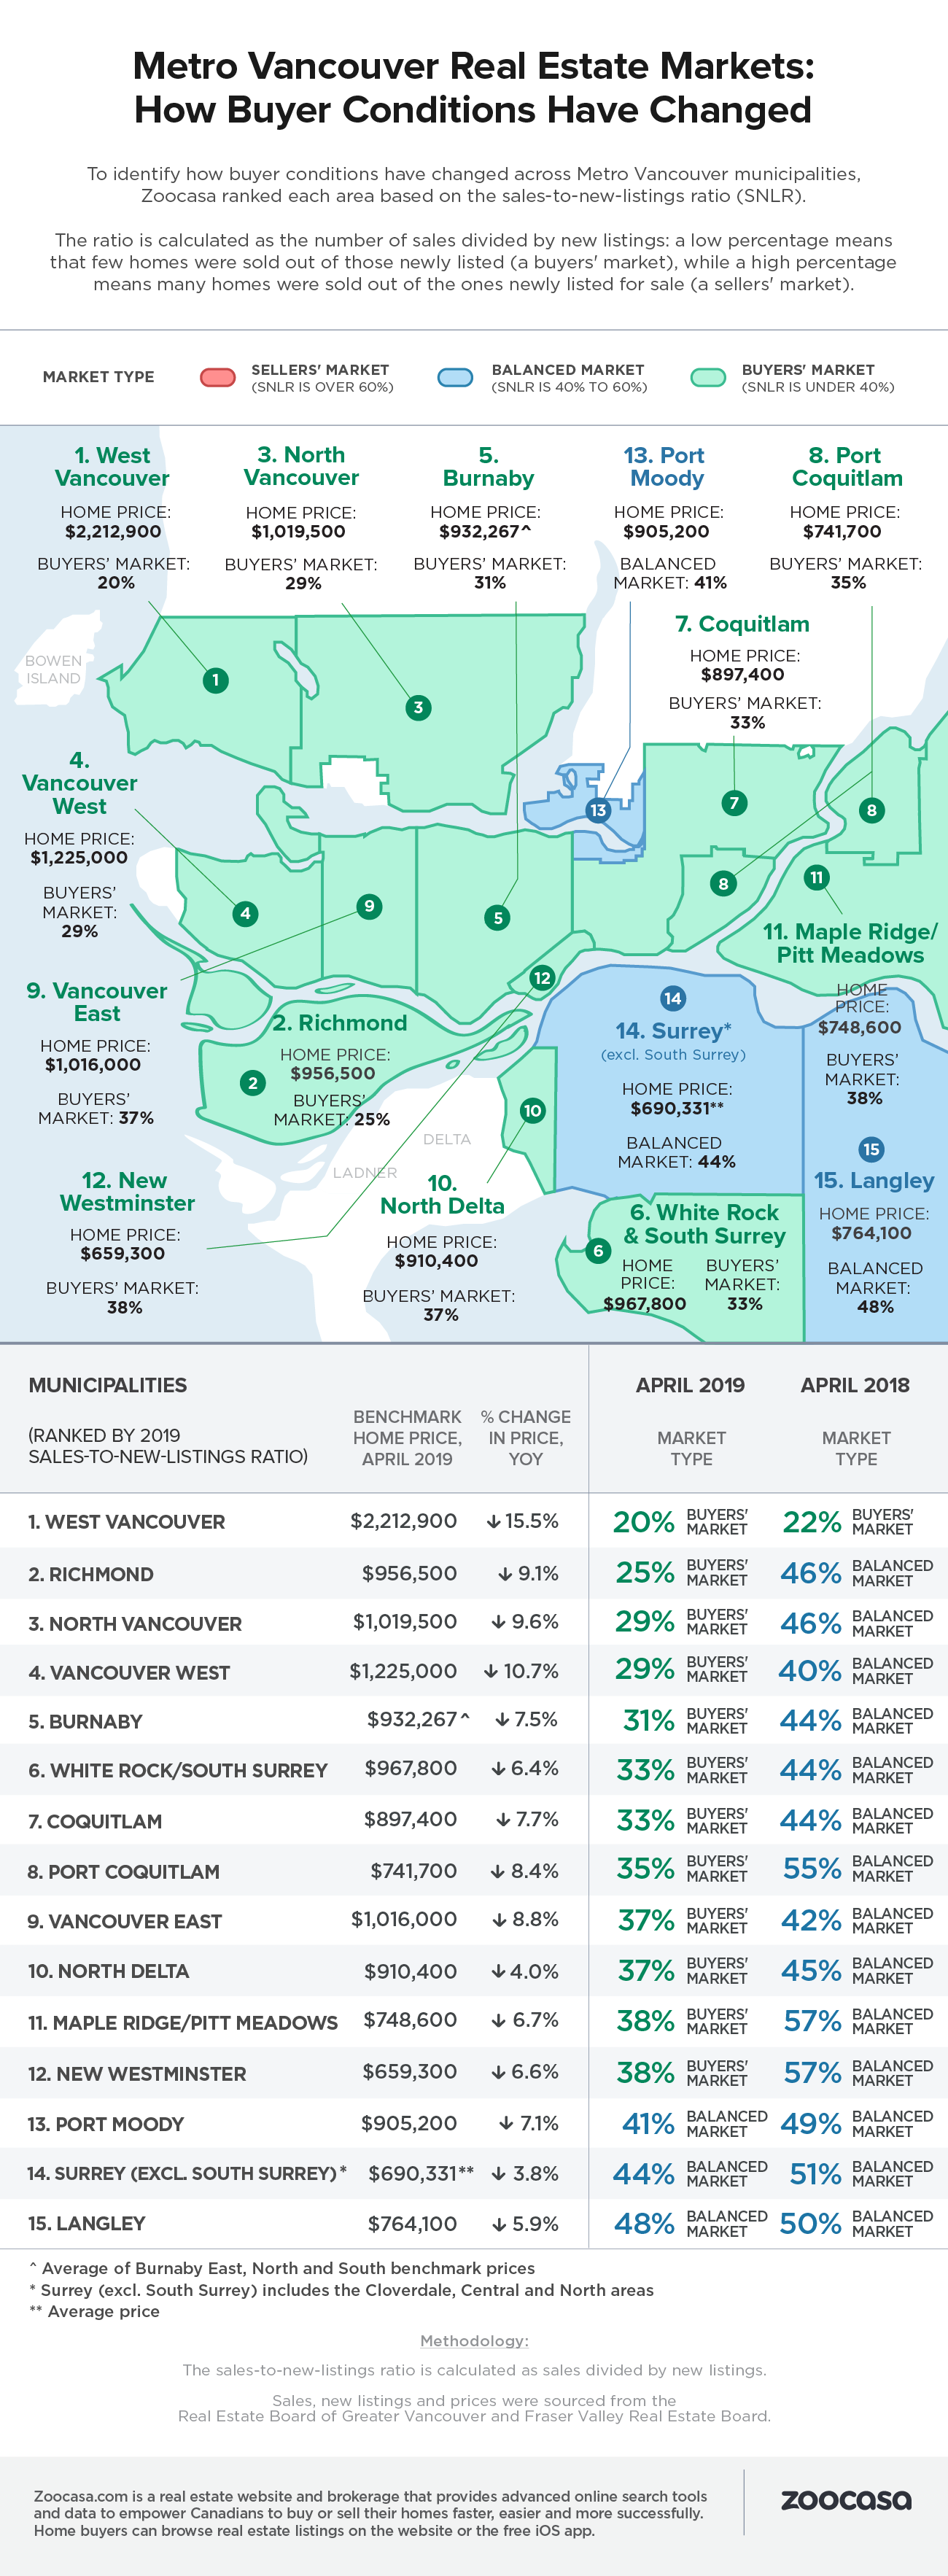
These graphs show the sales trends in Vancouver areas. Most areas still show dominant buyer’s market – North Vancouver – 29%, Vancouver East – 37% and West – 29%, Richmond – 25%, etc. Meaning that about every 5th listing gets sold (or out of 100 listings – 20-25-30 gets sold). However please NOTE that there are three areas based on these statistics that are already in balanced market – Port Moody – 41%, Surrey – 44% and Langley- 48% where up to half listed properties are sold. Source: Zoocasa, Vancouver Courier.
Full article Link:
https://www.vancourier.com/real-estate/updated-how-deep-is-the-housing-market-slowdown-in-your-area-infographic-1.23822197